Apple’s brilliant success since Steve Jobs returned in 1997 has made it the largest company in the world by almost any measure, with a market capitalization that exceeds Microsoft and Intel combined. iPhones define the smartphone market, even if they do not completely dominate it now that Android has taken the lead in market share. iPads, however, so completely dominate the tablet market that Amazon opted not to directly compete but instead to seek a different niche that will leave Apple as the undisputed king of the 10’” tablets – for now, at least.
Apple’s lineup of Mac computers and its releases of OS X upgrades are watched by bloggers and the media almost as lovingly as its mobile devices. When you see a computer used in a movie, there’s a good chance that it’s a Mac. “Everybody knows” that photographers and graphic designers use only Macs. Mac users proselytize loudly and vigorously for the superiority of computing on Macs, as always.
Perhaps you’ve assumed that Macs are starting to draw even with PCs in the market. It’s an easy mistake to make.
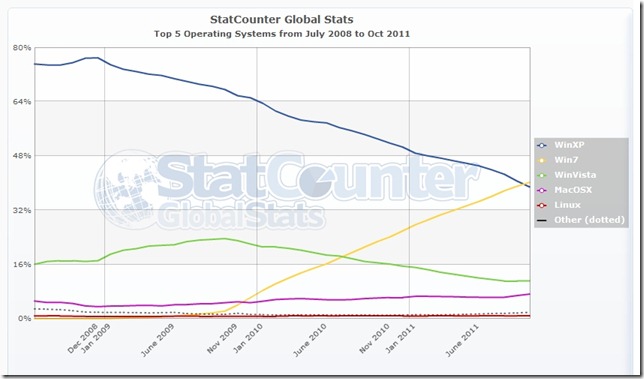
The chart below from StatCounter shows the global market share for desktop/notebook operating systems between July 2008 and October 2011.
- The blue line plunging down is Windows XP.
- The yellow line heading up to intersect it is Windows 7, which is now used on more PCs than Windows XP.
- The green line peaking in 2009 and then heading down is unloved, soon-to-be-forgotten Windows Vista.
- The flat pink line at the bottom is Mac OS X.
Apple’s global market share for desktop/notebook operating systems is currently 6.5%. It is trending upwards. Very, very slowly.
If you were to extend that chart back in time, you would discover that Apple’s line at the bottom has been flat roughly since the dawn of modern computing. Apple’s market share has grown from three or four per cent to slightly more than six percent.
This is an impressive achievement! The market for personal computers has grown so fast that it is a tribute to Apple that it has singlehandedly increased its market share against all the other vendors of Windows-based computers combined.
But – it’s probably not the chart you expected, is it?
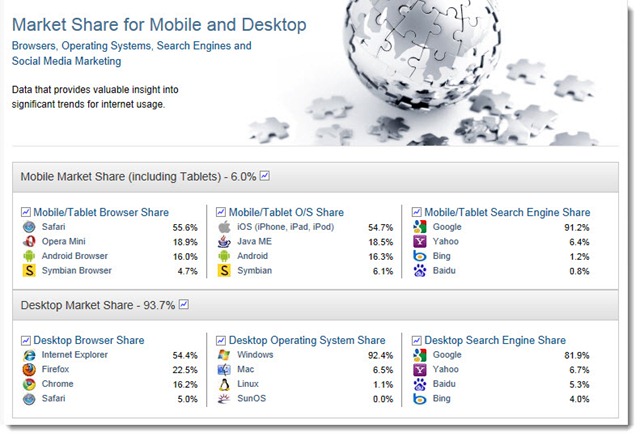
Here’s another visualization of current market share data from NetMarketShare:
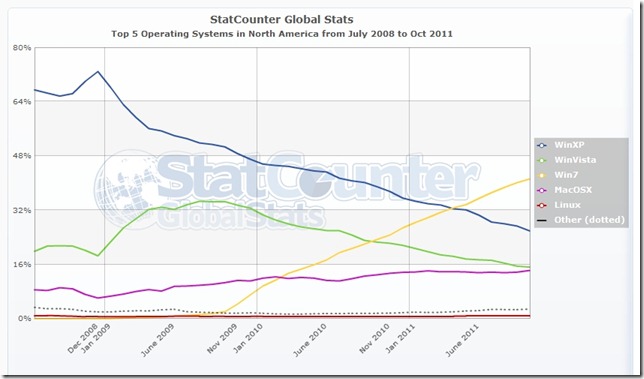
There are a thousand ways to dice and slice marketing numbers. Apple boosters will frequently focus only on sales numbers in the U.S., where Apple has a greater market share and has increased it more dramatically in the last three years. Do you have a guess about what that chart looks like?
Again, very impressive, but really, it’s not exactly a steep slope, is it?
Let’s do one more exercise to put another number in perspective.
Obviously mobile devices – smartphones and tablets – are selling like the proverbial hotcakes. Everybody has a smartphone, Apple can’t make iPhones and iPads fast enough to satisfy demand, the factories in Asia are sagging under the load, right? Right.
How does the number of computers in the world (desktops and notebooks) compare to the number of mobile devices (smartphones and tablets)?
Again, the world is changing, but perhaps not as fast as you might have guessed. Here are the statistics displayed on the front page of NetMarketShare tonight:
Based on the number of devices in each category:
- Mobile market share – 6.0%
- Desktop market share – 93.7%
Perspective matters! Don’t underestimate the momentum and effectiveness of a company that’s as important as Apple – but don’t be fooled into overstating its influence either. It’s a Windows world out there, built on personal computers, and it will continue to be for quite a while to come.


