Reliability Monitor is the best Windows troubleshooting tool that you’re not using, which is a shame, but I understand. If you’re an IT pro, then you probably forgot about it, and who can blame you with so many things to remember because computers are too damn hard to use? If you’re the person down the hall who is summoned when a printer doesn’t work, or the thirty-something that the family calls for help because everyone knows that youngsters are born with genetic knowledge of how computers work, you’ve probably never heard of Reliability Monitor. It’s an overlooked, very useful tool. It deserves love.
Reliability Monitor tracks your computer’s history – any time an application crashes or Windows goes down with a blue screen of death. It also tracks other important events, like when software is installed or Windows Updates loads a new patch.
I see IT pros sneering, “I can get the same information from Event Viewer and Procmon with only twelve clicks to develop custom filters.” You’re very special and we need you and you are deeply appreciated, but hush, now you have to let us lightweights play at the very edge of your sandbox.
How to run Reliability Monitor

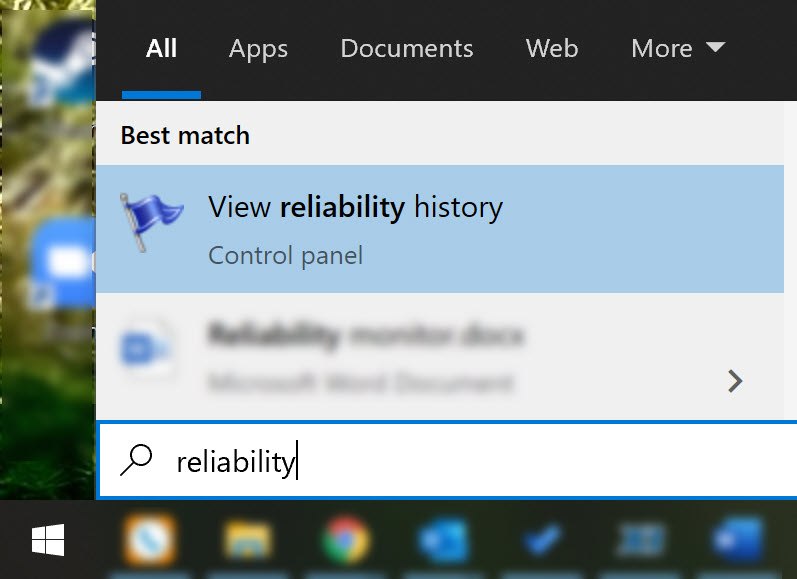
Click on Start and start typing reliability, then click on View reliability history.
What you can find out from Reliability Monitor

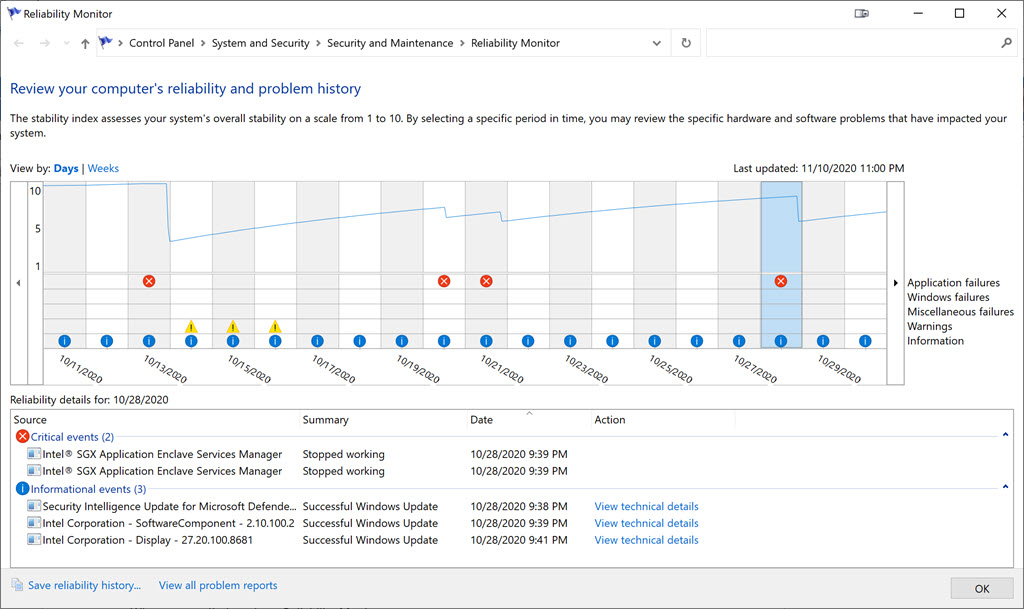
Reliability Monitor gathers information continuously from your system, and shows you interesting events day by day.
The squiggly line at the top rates the reliability of the computer on a scale from 1 to 10. It doesn’t mean anything but everyone loves a graph. Turn it into a game – can you get your line up to 10 and keep it there? (Spoiler: no, of course not. This is a Windows computer. Things will explode every so often because that’s what life is like with a Windows computer.)
Red Xs and exclamation points in the next section reflect critical events sorted into categories – program crashes, Windows crashes, and warnings. Almost every day also has routine updates and other non-critical events listed as “information.” Highlight a day and you’ll see details in the pane below.
In the screenshot above, for example, the Intel SGX Application Enclave Services Manager crashed a couple of times right after a couple of Intel display updates were installed. It never happened again. Now, like you, I treasure the Intel SGX Application Enclave Services Manager – I mean, who wouldn’t, after all the fun we’ve had together? But it’s never crashed again, so I never need to know what it is, which makes me smile.
You can double-click a line or click on a link to “View technical details,” which more or less pops up the same kind of info you get from Event Viewer. Sometimes you’ll see a link to “Check for a solution,” which is usually a cruel hoax, of course.
Any other fun facts about Reliability Monitor?
Reliability Monitor was released more than twelve years ago for Server 2008. Microsoft thought it would mostly be used by system admins to diagnose server problems, so it was never pushed as a diagnostic tool for workstations, even though it has been part of every version of Windows since then – Windows Vista, 7, 8, 8.1, and 10. It remains relatively unknown.
You can toggle between daily and weekly views of system problems. At the bottom is a link to present all problem reports in a single screen, with lots of options to drill deeper on the right-click menus in the report.
Reliability Monitor is actually a subset of Performance Monitor – you can start it by running perfmon /rel
There is no easier way for administrators and power users to get a quick idea of what is causing system errors. It’s an old tool that you forgot about and it really should be your new best friend. Remember it for next time.
